
Stop chasing short-term noise. Learn the simplest, most powerful long-term trend indicator—the 200-Day Moving Average (200 DMA). Expert strategies for finding quality stocks near 200 DMA.
Have you ever felt like the stock market is a chaotic crowd, shouting buy and sell signals at the top of its lungs? One day, your stock is up 5%; the next, it’s down 3%. It’s enough to give anyone a serious case of analysis paralysis.
The real problem isn’t the market’s chaos; it’s the lack of a reliable, long-term filter. What if I told you there’s one, single line you can draw on a chart—a line that institutional investors, mutual funds, and market legends have used for decades to cut through the noise and spot the big trend?
This line is the 200-Day Moving Average (200 DMA).
For an intelligent, long-term investor, the 200 DMA isn’t just a technical line; it’s a profound statement about a stock’s underlying health and sentiment. Think of it as the ultimate financial filter.
In this deep-dive, you’ll learn exactly what the 200 DMA is, why looking for stocks near 200 DMA is the smartest strategy a beginner or seasoned investor can adopt, and how to apply this time-tested principle to build a robust portfolio in the Indian markets. We’re going to strip away the jargon and give you an actionable roadmap.
The 200 DMA: The Long-Term Truth-Teller
Imagine you’re managing a large warehouse filled with inventory. You don’t judge the health of your business by what one customer bought this morning; you look at the average sales over the last six months. The 200 DMA is your stock’s six-month sales average (roughly 40 trading weeks).
What is the 200-Day Moving Average?
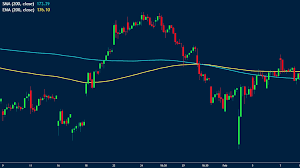
The 200-Day Moving Average (200 DMA) is the average of a stock’s closing price over the last 200 trading days. It is a Simple Moving Average (SMA), meaning every day’s price is given equal weight.
Its power lies in its simplicity. By averaging 200 data points, the daily volatility—the “noise” and “chatter” of the market—is smoothed out, revealing the true, underlying long-term trend.
- Stock Price ABOVE 200 DMA: This is the most common interpretation. It signals a bullish long-term trend. The average investor is willing to pay more than the average price over the last 200 days, indicating positive momentum and sentiment. {long-term trend}
- Stock Price BELOW 200 DMA: This signals a bearish or negative long-term trend. The stock is trading below its long-term average, suggesting recent weakness or a shift in the major trend.
- Stocks NEAR 200 DMA: This is the sweet spot we are interested in. It indicates a critical inflection point, where the battle between bulls and bears is about to be won, often leading to a major trend continuation or reversal.
🧠 What You Should Remember
The 200 DMA is a lagging indicator that filters out short-term market noise to reveal the true long-term trend. When a stock trades above it, the prevailing narrative is one of health and strength.
The Strategic Importance of Stocks Near 200 DMA
Why do serious investors obsess over stocks near 200 DMA? Because this line acts like a magnet, a psychological fulcrum, and a critical line in the sand for massive institutional money.
It Functions as a Self-Fulfilling Prophecy (Support & Resistance)
The market isn’t just about prices; it’s about psychology. Because so many large, powerful players use the 200 DMA as a primary trend filter, the line often becomes a self-fulfilling prophecy.
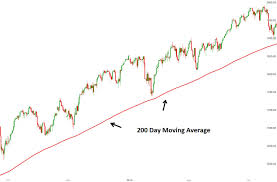
- Support: When a stock is in a long-term uptrend (trading above the 200 DMA) and its price falls to touch or come close to the moving average, it frequently acts as a support level—a “floor.” Large investors, seeing the stock dip to its long-term average, view it as a discounted buying opportunity and step in, causing the price to bounce back up. This is a powerful buy signal for trend-following investors.
- Resistance: Conversely, if a stock is in a downtrend (trading below the 200 DMA) and its price rallies to touch the moving average, it often acts as a resistance level—a “ceiling.” Traders who bought at higher prices might use this bounce to exit their positions, selling at the long-term average price and pushing the stock back down.
When a stock is near this line, it is at a moment of truth. It’s either gathering the strength to punch through resistance or bouncing back from key support. This is where the highest probability, risk-managed trades and long-term entry points are found. {market sentiment}
The Institutional Checkpoint Analogy
Think of the 200 DMA as the check-post on a national highway (NH 44 in India, for example). All the big cargo trucks (the institutional money: FIIs, DIIs) have a rule: they only want to drive on the main highway, not the bumpy village roads (short-term volatility).
- If a stock is firmly above the 200 DMA, the gate is open; the big money keeps pouring in.
- If a stock is consistently below the 200 DMA, the gate is closed; the big money stays away.
- If a stock is near the 200 DMA, it’s at the checkpoint. A brief fall to the line, followed by a surge, confirms the route is safe and a fresh journey (uptrend continuation) is about to begin. This is a high-conviction entry point. {institutional buying}
🧠 What You Should Remember
The 200 DMA is the most-watched support and resistance line by institutional investors globally. A stock testing the 200 DMA from above (as support) or breaking above it (as a trend reversal) represents an optimal risk-reward scenario.
Strategy 1: The “Sweet Spot” Buy—Finding Trend Continuation
The most powerful way to use the 200 DMA is to identify fundamentally strong companies that are undergoing a temporary “sale” or pullback within an established uptrend.
Identifying Quality Pullbacks
When a stock is consistently trading well above its 200 DMA (say, 20-30% above), it can be intimidating to buy. Eventually, profit-booking or general market corrections pull the stock price back down. The ideal long-term entry point is when this correction brings the price down to the 200 DMA line itself.
The Strategy:
- Filter for Strength: Only consider stocks that have been in a clear, visible long-term uptrend for the past 12-24 months. Look for charts where the 200 DMA line itself is rising—it’s pointing north.
- Wait for the Retest: The stock price corrects and touches or comes within 2-3% of the rising 200 DMA. This move is the market taking a breather.
- Look for the Bounce (Confirmation): Crucially, you wait for a confirmation signal. This is usually a strong, large green candlestick (a bullish reversal candle) on the daily chart, often accompanied by above-average volume. This confirms that the big buyers have stepped in to defend the long-term trend line.
- Entry and Exit: Buy on the confirmation candle. Place your stop-loss just below the 200 DMA line. This keeps your risk small while allowing you to ride the renewed long-term trend.
Indian Market Example Analogy (The Cricket Match):
Imagine a star batsman (the stock) hitting sixes (price soaring) but getting tired after a few overs (the pullback). He takes a break at the drinks interval (the 200 DMA line). A smart captain (the investor) doesn’t panic. They wait to see the batsman take a fresh guard and hit the next ball for four (the bounce confirmation) before cheering for a long innings (the uptrend continuation).
Common Mistake: Buying the First Bounce
Many retail traders jump in the moment the price touches the 200 DMA. Don’t do this. It’s a common trap. You must wait for the price action to confirm that the support is holding. Without confirmation (the volume-backed bounce), you might be catching a falling knife. {risk management}
🧠 What You Should Remember
The safest, highest-probability entry is when a fundamentally sound stock that is already in an uptrend pulls back and successfully tests the rising 200 DMA as support, confirmed by strong buying volume.
Strategy 2: The Trend Reversal—Harnessing the Power of Crossovers
While Strategy 1 focuses on continuation, Strategy 2 focuses on detecting a massive, game-changing shift in the stock’s long-term trajectory. This is where the famous Golden Cross comes into play.
The Golden Cross and the Death Cross
For this strategy, we pair the 200 DMA with a shorter-term moving average, typically the 50-Day Moving Average (50 DMA). The 50 DMA is your medium-term momentum check.
A. The Golden Cross (The Buy Signal 🌟)
A Golden Cross occurs when the shorter-term 50 DMA line crosses above the longer-term 200 DMA line.
- What it means: It signals that the average price momentum over the last two months (50 days) has become significantly stronger than the long-term average price (200 days). This is a strong indicator of a major, potential shift from a long-term downtrend (or consolidation) into a new, powerful uptrend.
- The Mindset Shift: The stock has gone from “unwanted” to “the hot new topic.” It suggests a fundamental change has occurred—perhaps a massive new contract, a major product launch, or an unexpected earnings beat—that is permanently changing the investment thesis.
B. The Death Cross (The Warning Sign 💀)
A Death Cross occurs when the shorter-term 50 DMA line crosses below the longer-term 200 DMA line.
- What it means: It signals a significant deterioration in the stock’s long-term health. The recent two-month price action is now weaker than the long-term average, indicating a structural shift into a bearish trend. This is a loud, clear signal to reduce exposure or exit a long-term holding.
Combining Technicals with Fundamentals
A crossover, by itself, is only a signal. To avoid false breakouts (where the stock crosses the line only to reverse immediately), you must confirm the move with fundamental analysis.
- For a Golden Cross: Look for accompanying factors like a jump in quarterly earnings, consistent sales growth, an improvement in Return on Equity (ROE) or Return on Capital Employed (ROCE), or news of a strong management change. The technical chart and the company’s report card must tell the same story.
- The Volume Check: A Golden Cross that happens on heavy, sustained trading volume is significantly more reliable than one that sneaks in quietly. High volume confirms that informed money is participating in the bullish breakout. {fundamental analysis}
🧠 What You Should Remember
The Golden Cross (50 DMA above 200 DMA) is the most-anticipated trend reversal signal, indicating a major shift to bullish momentum. Always confirm this signal with strong volume and robust fundamental news to filter out traps.
Strategy 3: The Safety Net—Using the 200 DMA for Risk Management
Even the best stock pickers get it wrong sometimes. The true mark of an expert is not how well they pick a stock, but how well they manage their risk. The 200 DMA is a fantastic, objective tool for setting a stop-loss.
Stop-Loss Setting: A Non-Negotiable Rule
If you buy a stock in an uptrend that is well above its 200 DMA, and it suddenly breaches the 200 DMA and closes below it, that is the market telling you the long-term trend has been violated.
- The Rule: If your stock closes two consecutive days below the 200 DMA, it is time to sell and reassess.
- Why Two Days? A single day’s closing below the line can be a “whipsaw” or a market overreaction. Waiting for a second day confirms that the selling pressure is sustained and the long-term average is no longer holding up. This simple rule protects you from turning a minor correction into a massive loss.
The “Capital Preservation” Mindset
Legendary investors like Paul Tudor Jones famously use the 200 DMA as a critical element of their risk framework. He believed that avoiding massive losses is more important than chasing huge gains.
- In a Bear Market: If the majority of the market’s stocks (e.g., more than 60% of the Nifty 500) are trading below their 200 DMAs, the overall market is sick—it’s a bear market. In this scenario, your primary strategy should shift from aggressive buying to capital preservation. It’s time to reduce your stock exposure, increase your cash holdings, and wait for the market to heal. Trying to be a hero in a market where the majority of stocks are in a downtrend is a recipe for disaster. {capital preservation}
Analogies for Risk
The 200 DMA as a stop-loss is like a safety cord in rock climbing. It doesn’t help you climb, but it absolutely saves your life if you fall. Similarly, adhering to the 200 DMA stop-loss rule saves your capital when your investment thesis breaks down.
🧠 What You Should Remember
Always use the 200 DMA as your ultimate stop-loss. A close below the line for two consecutive trading days is a clear signal to exit your position and protect your capital from a potential long-term trend reversal.
The 200 DMA Checklist: Finding Your Next Multibagger
You now have the knowledge. Here is the final, actionable checklist for using the 200 DMA to screen for high-quality, long-term wealth builders in the Indian market.
| Filter | Criteria | Why it Matters |
| Long-Term Trend | Current Price > 200 DMA | Confirms the stock is in a sustainable long-term uptrend. |
| Momentum Check | 50 DMA > 200 DMA | Confirms the medium-term momentum is supportive (A Golden Cross structure). |
| Proximity for Entry | Price is within 0% to 5% of the 200 DMA | Indicates an optimal, discounted entry point near a major support level. |
| Volume Confirmation | Volume at the 200 DMA test or breakout is above the 50-day average volume | Confirms that smart, informed institutional buyers are participating in the move. |
| Fundamental Health | ROE & ROCE > 15% for the last 3-5 years | Ensures the underlying business is profitable, not just a technical pump-and-dump. |
| Management Quality | Low debt-to-equity ratio and consistent dividend history | Ensures financial stability and honest, capital-efficient management. |
To find these stocks, use the screeners provided by Indian financial platforms. Set a custom screen for “Current Price > 200 DMA” and then manually check the charts for the price action at the 200 DMA line. The goal is to find strength on the chart and quality in the books.
Final Thoughts and CTA
The beauty of the 200-Day Moving Average is that it provides an objective, emotional-free framework for making your biggest investment decisions. It shifts your focus from the daily noise to the annual narrative, from gambling to disciplined strategy. It is the simple edge that separates the serious investor from the short-term speculator.
If you can master the discipline of only looking for stocks near 200 DMA with strong fundamentals, you’ll be aligning your investments with the core principle of wealth creation: buying quality at a reasonable price and letting the long-term trend do the heavy lifting.
What is one stock you own right now that is trading significantly below its 200 DMA, and what is your plan for it based on this new knowledge? Share your thoughts in the comments below!
Leave a Reply